
A flat line on a position-time graph: what stops?
A flat line on a position-time graph means the position stays constant throughout that interval. For motion constrained to a straight line, the object is at rest relative to the chosen reference. The line can sit above or below zero. Its height gives position; its zero slope gives zero velocity. Here is how to justify that answer and spot cases where the evidence is weaker.

A flat line on a position-time graph keeps one position
Start by reading the quantity and unit on each axis. In this guide, time t in seconds runs horizontally and position x in metres runs vertically. The object can move only along one straight track. We choose a fixed origin and call one direction positive. Position is a coordinate measured from that origin, not a running total of all movement.
Imagine a cart at x = 10 m for an entire three-second interval. The clock advances, but the position does not change. On the graph, you move right along a horizontal segment. You are not drawing the physical track: the horizontal direction on the page represents later times, not motion across the room. Saying “the cart travels horizontally because the line is horizontal” confuses the graph with a picture of the journey.
The same reasoning works at x = −4 m. A negative coordinate locates the cart on the other side of the chosen origin; it does not force the cart to move. Our physics homework guide explains the broader distinction between position, displacement and speed. For this task, keep one question in view: does this coordinate change while time passes?
Find both pauses in an original model
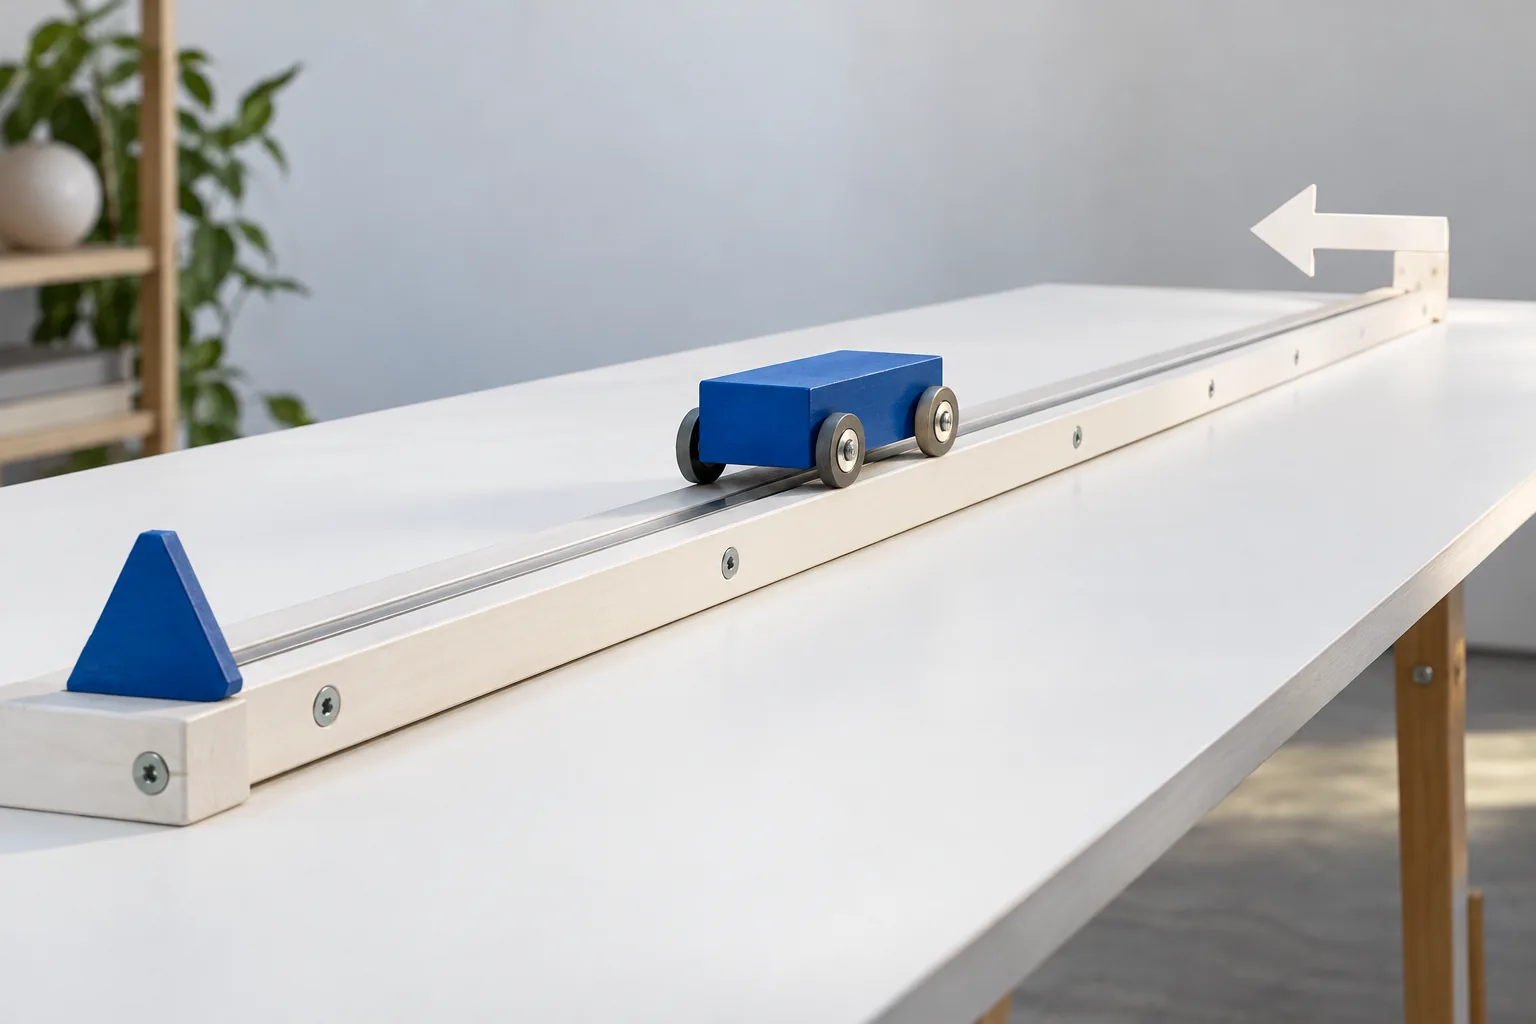
Use the invented model below. It represents a cart moving along a straight track, with straight graph segments between the listed coordinates. Those connecting segments are part of the stated model. The picture illustrates an ideal journey, not measurements from a classroom experiment. The photographs elsewhere in this article illustrate study activities; they do not supply the graph data.
| Time t (s) | Position x (m) |
|---|---|
| 0 | 2 |
| 4 | 10 |
| 7 | 10 |
| 9 | 6 |
| 11 | 6 |
From 0 to 4 s, position increases from 2 to 10 m. From 4 to 7 s, it stays at 10 m. From 7 to 9 s, it decreases to 6 m. From 9 to 11 s, it stays at 6 m. The two horizontal intervals therefore describe two pauses at different places.
Read the endpoints of each interval from the time axis. The first pause lasts 7 − 4 = 3 s; the second lasts 11 − 9 = 2 s. Their combined duration is 5 s. The coordinate 10 m describes where the first pause occurs. It is neither its duration nor a velocity. A complete answer could be: “The cart is stationary at x = 10 m between 4 and 7 s, for three seconds.”

Use changes, not the height of the line
For a straight position-time segment, velocity is the change in position divided by the elapsed time: v = (x₂ − x₁)/(t₂ − t₁). Select two different times within that same segment. The numerator and denominator must refer to the same interval. Subtract later minus earlier in both places so that the sign remains meaningful.
During the first pause, v = (10 − 10)/(7 − 4) = 0/3 = 0 m/s. Dividing 10 by 7 would answer a different, unjustified question: it uses the final coordinate instead of the change and assumes an interval starting at the origin. Even the first moving segment starts at x = 2 m, so its velocity is (10 − 2)/(4 − 0) = 2 m/s, not 10/4.
A useful check is to imagine shifting the position origin by 20 m. The first pause would then have coordinate −10 m, but both endpoint positions shift equally. Their difference remains zero. Where you place zero changes the graph height; it does not change whether the cart moves. OpenStax’s position-time reference explains the connection between a segment’s slope and velocity. Our coordinates and calculations here are original practice cases.
Check whether the vertical axis is velocity instead
Now imagine a different graph whose vertical axis reads velocity in m/s. A horizontal line at +10 m/s means the velocity stays at +10 m/s. The object is moving in the positive direction. Only a horizontal velocity-time segment at zero represents rest throughout that interval. The shape alone cannot distinguish these two situations because the quantities on the axes do that work.
Compare two short explanations. “The line is flat, so the cart stops” omits the graph type. “Position remains 10 m from 4 to 7 s, so the position change is zero and the cart is stationary” supplies the quantity, interval and reason. For a velocity graph, the corresponding statement would describe a constant velocity, not a constant position.
Units offer another check. Position change divided by time gives m/s. Velocity change divided by time gives m/s², an acceleration. On a flat velocity-time segment, acceleration is zero; velocity need not be. The science homework guide shows why the requested quantity matters when interpreting a graph. Before using a remembered rule, say the full names of both axes aloud.

Try the next step with your own homework.
Bring your question and attempt into Lirno. Ask for a hint, discuss the reasoning, then try the next step yourself.
A falling segment can still have positive positions
Return to the original model between 7 and 9 s. Position falls from 10 to 6 m, so v = (6 − 10)/(9 − 7) = −4/2 = −2 m/s. The cart moves in the negative direction along our chosen axis. Because both positions are positive, it moves toward the origin during this segment without reaching it. The minus sign describes direction, not a negative amount of speed.
The speed on that segment is 2 m/s, the magnitude of the velocity. On the initial rising segment it is also 2 m/s. The cart therefore has equal speeds on those two straight segments, although their slopes have opposite signs. A line farther above the time axis is not automatically a faster journey; compare changes over equal durations or calculate the slopes.
Distinguish this graph from cumulative distance travelled. A running total of path length cannot decrease as the cart returns. A position coordinate can decrease. A worksheet may use words such as “distance from the start” loosely, so check the definition or ask for clarification before assigning direction. Alloprof’s French-language position reference describes position relative to a reference and interprets stationary intervals.
Equal endpoint readings do not prove a continuous pause
Suppose you are given only two observations: x = 10 m at 4 s and x = 10 m at 7 s. You have not been told what happens between them. The net displacement is zero, and the average velocity over those three seconds is zero. That alone does not establish that the cart remained still throughout the interval.
For a counterexample, let it move from 10 to 12 m and then back to 10 m during those three seconds. It covers 4 m of path while finishing at the same coordinate. Both endpoint readings still match. You need the stated continuous horizontal model, additional observations or a condition ruling out an unseen excursion before describing an uninterrupted pause.
The dimensional scope matters too. If a graph shows only an object’s horizontal coordinate while it is free to move vertically, a constant horizontal coordinate does not rule out vertical motion. Our straight-track assumption avoids that ambiguity. In an actual experiment, finite resolution and gaps between observations also limit what can be concluded. Report the supplied precision; do not turn a visually almost-flat trace into a claim of mathematically exact zero motion without considering the measurement context.
Test the idea with negative coordinates
Try a second original model before reading the solution. Its points are (0 s, −3 m), (2 s, 1 m), (5 s, 1 m) and (8 s, −5 m), joined by straight segments. Identify the stationary interval, its duration and position. Then decide whether crossing x = 0 means the cart stops. Use the actual changes rather than matching the new picture to the first one.
The pause runs from 2 to 5 s at x = 1 m, lasting 3 s. The first segment has velocity (1 − (−3))/(2 − 0) = 2 m/s. The last segment has velocity (−5 − 1)/(8 − 5) = −2 m/s. Negative endpoint positions did not make the first velocity negative; the direction of change determined the sign.
On the last segment, the cart reaches x = 0 half a second after 5 s, at 5.5 s. It continues through the origin because that segment’s velocity remains −2 m/s. A zero position is a location, not a pause. Likewise, the first segment crosses the origin at 1.5 s without stopping. If you missed that distinction, sketch a number line and mark the cart’s successive positions before returning to the time graph.
Finish with a precise explanation
Use a compact answer structure: name the graph type, state the interval, compare positions and give the conclusion with units. For the first model: “This is position against time. Between 4 and 7 s, x stays at 10 m. Thus Δx = 0 over 3 s, giving v = 0 m/s; the cart is stationary in the stated one-dimensional reference frame.” Every part can be checked against the model.
Keep the conclusion within the interval. Our ideal graph has sharp corners where the slope changes abruptly. It does not describe the detailed acceleration during a real start, stop or reversal. Do not use the pause to claim that no forces act, either: an object can remain still while forces balance. The position graph supports a motion statement, not a complete force diagram.
Finally, change one feature yourself. Move a horizontal segment lower, lengthen it, or replace the vertical label with velocity. Explain which conclusions change and which survive. Record a recurring confusion and its correction using the approach in the mistake-review guide. Being able to justify the changed case is a better check of this specific skill than memorising “flat means stopped” without its conditions.

Questions about this method
Does a horizontal position-time line have to be at zero?
No. It can be at any constant position. A line at 10 m means the object stays at that coordinate; the zero slope, rather than the height, gives zero velocity. This assumes motion along the stated line relative to a fixed reference.
Does zero average velocity mean the object never moved?
No. An object can move away and return to the same position. Equal endpoint positions give zero net displacement. A continuous flat position-time interval is stronger information than just two equal endpoint observations.
Can I tell why the object stopped from this graph?
The graph shows when and where the position stays constant. It does not by itself establish the cause, the individual forces or the real acceleration during the transition. Use any additional physical information supplied by the question.